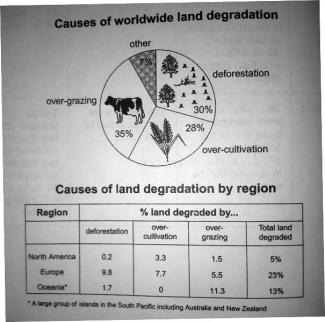
The pie chart below shows the main reasons why agricultural land become less productive. The table shows how these causes affected three regions of the world during the 1990s.

The pie chart demonstrates the causes which hinder the productivity of agricultural lands, and the table illustrates the percentages of the impacts of the causes in different countries in the 1990s as well.
Looking at the pie chart, it can be clearly seen that chopping down the trees constitutes 30% of the detrimental causes, and over-grazing comprises 35% of the damaging reasons. In addition, another cause, which accounts for 28% of the harmful reasons, is over-cultivation. Also other reasons could have some detrimental effects up to a mere 7%.
Moving to the table, in the 1990s, in North America, the most harmful effect was over-cultivation (3.3%), followed by over-grazing (1.5%) and deforestation (0.2%). In Europe, cutting down the trees had the most deleterious effect (9.8%), whereas over-grazing had the least harmful impact (5.5%). Turning to Oceania, over-cultivation had no damaging impact, while over-grazing was the most detrimental cause (11.3).
In conclusion, over-grazing, over-cultivation, and deforestation are the prime obstacles to the productivity of the farmlands in all over the globe.

flaws:
Need to compare and contrast by the main features, and make comparisons where relevant. Don't just go details.
Also you forget the total land degraded.
Attribute Value Ideal
Score: 6.0 out of 9
Category: Satisfactory Excellent
No. of Grammatical Errors: 0 2
No. of Spelling Errors: 0 2
No. of Sentences: 8 10
No. of Words: 170 200
No. of Characters: 900 1000
No. of Different Words: 97 100
Fourth Root of Number of Words: 3.611 4.0
Average Word Length: 5.294 4.6
Word Length SD: 3.443 2.4
No. of Words greater than 5 chars: 60 60
No. of Words greater than 6 chars: 50 50
No. of Words greater than 7 chars: 34 40
No. of Words greater than 8 chars: 28 20
Use of Passive Voice (%): 0 0
Avg. Sentence Length: 21.25 21.0
Sentence Length SD: 6.666 7.5
Use of Discourse Markers (%): 0.75 0.12
Sentence-Text Coherence: 0.484 0.35
Sentence-Para Coherence: 0.749 0.50
Sentence-Sentence Coherence: 0.177 0.07
Number of Paragraphs: 4 4