The table below gives information about changes in modes of travel in England between 1985 and 2000.
Describe the information in the table and make comparisons where appropriate.
» Write at least 150 words.
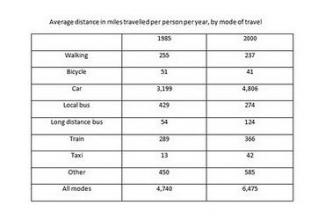
The table illustrates about the changes occurred in travel modes in England between given periods of 15 years. The data has been calibrated in the miles.
To commence with, in 1985 the highest distance travelled by car which was at peak in 2000 followed by other vehicles in the same year by 585 miles. The lowest distance was travelled by per person using taxi in 13 miles in 1985 and in end of 20th century by bicycle in 41 miles. Local buses was at 3rd place for travel use in 1980 while trains were at the same place for travel use in 2000. The distance travelled by long bus was 54 in 1985 which jumped to 124 miles in 2000.
Overall, it is crystal clear that in 1985 average distance by all modes was lower than in 2000 and in same year only distance travelled by walking, bycycle and local bus was plumpet comparing to other modes of travel.

Comments
does i deserve 6.5 without
does i deserve 6.5 without these errors
Yes. Double check grammar &
Yes. Double check grammar & spelling issues after essay writing.
please tell me how could i
please tell me how could i get 7 band in task 1. Thanks
For the graphs like table,
For the graphs like table, you need more comparisons and contrast. Most of the content should like what you did in the conclusion:
Overall, it is crystal clear that in 1985 average distance by all modes was lower than in 2000 and in same year only distance travelled by walking, bycycle and local bus was plumpet comparing to other modes of travel.
but need to go details, for example for taxi and long distance bus, you said:
The lowest distance was travelled by per person using taxi in 13 miles in 1985 and in end of 20th century by bicycle in 41 miles.
The distance travelled by long bus was 54 in 1985 which jumped to 124 miles in 2000.
this is not enough, you need to put them to the same category which had a big jump.
for car, train, and other, they belong to another category. walking, bicycle and local bus belong to another category.
So try to put more content, don't expect 7.0 with only 159 words.
-----------------------
another important thing for 7.0 in writing section is that there should be no any grammar errors. Double check grammar & spelling issues after essay writing.
and in end of 20th century
and at the end of the 20th century
was at 3rd place
was at the 3rd place
and in same year
and in the same year
Sentence: Overall, it is crystal clear that in 1985 average distance by all modes was lower than in 2000 and in same year only distance travelled by walking, bycycle and local bus was plumpet comparing to other modes of travel.
Error: plumpet Suggestion: plumped
Error: bycycle Suggestion: bicycle
flaws:
No. of Grammatical Errors: 3 2
No. of Words: 159 200
Attribute Value Ideal
Score: 6.0 out of 9
Category: Satisfactory Excellent
No. of Grammatical Errors: 3 2
No. of Spelling Errors: 2 2
No. of Sentences: 7 10
No. of Words: 159 200
No. of Characters: 678 1000
No. of Different Words: 86 100
Fourth Root of Number of Words: 3.551 4.0
Average Word Length: 4.264 4.6
Word Length SD: 2.112 2.4
No. of Words greater than 5 chars: 37 60
No. of Words greater than 6 chars: 29 50
No. of Words greater than 7 chars: 16 40
No. of Words greater than 8 chars: 7 20
Use of Passive Voice (%): 0 0
Avg. Sentence Length: 22.714 21.0
Sentence Length SD: 9.067 7.5
Use of Discourse Markers (%): 0.143 0.12
Sentence-Text Coherence: 0.475 0.35
Sentence-Para Coherence: 0.684 0.50
Sentence-Sentence Coherence: 0.11 0.07
Number of Paragraphs: 3 4