The table below shows the amount of waste production (in millions of tonnes) in six different countries over a twenty-year period.
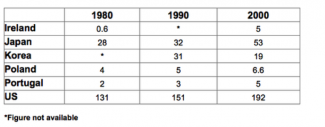
The table illustrates the amount of waste produced in six countries from 1980 to 2000. In general, it can be seen that steady upward trends can be found in three mainly countries, namely US, Japan, and Ireland, and the emission of US recorded by far the biggest figure. By contrast, it is also noticeable that Poland and Portugal produced much less waste than the other nations.
Looking at the countries emphasizing on industry, the amount of waste production in the US rose from 131 to 192 million tonnnes between 1980 and 2000. In addition, Japan was another heavy industrialized country, the am...
Subscribe as testbig VIP readers and get unlimited access to essays on the top list.

Attribute Value Ideal
Score: 7.5 out of 9
Category: Very Good Excellent
No. of Grammatical Errors: 0 2
No. of Spelling Errors: 0 2
No. of Sentences: 6 10
No. of Words: 178 200
No. of Characters: 845 1000
No. of Different Words: 100 100
Fourth Root of Number of Words: 3.653 4.0
Average Word Length: 4.747 4.6
Word Length SD: 2.572 2.4
No. of Words greater than 5 chars: 63 60
No. of Words greater than 6 chars: 46 50
No. of Words greater than 7 chars: 30 40
No. of Words greater than 8 chars: 16 20
Use of Passive Voice (%): 0 0
Avg. Sentence Length: 29.667 21.0
Sentence Length SD: 11.101 7.5
Use of Discourse Markers (%): 0.667 0.12
Sentence-Text Coherence: 0.522 0.35
Sentence-Para Coherence: 0.721 0.50
Sentence-Sentence Coherence: 0.199 0.07
Number of Paragraphs: 3 4