the three pie charts below show the changes in annual spending by a particular UK school in 1981,1991 and 2001.
Summarize the information by selecting and reporting the main features, and make comparisons where relevant
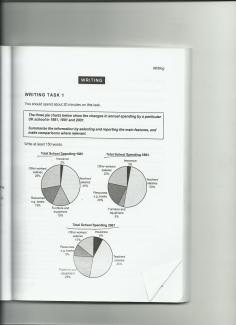
The pie charts represent the properties which are expended annually by UK school within 2 decades.
It is clear that the proportion of teachers’ salaries is the greatest in all the years whereas the insurance is the smallest and it goes up slightly over the years. Other the percentage of workers’ salaries is approximately more than a quarter of the total(28%) and far higher than the others while the resources e.g. books and furniture and equipment are 15% separately.
Turning to the graph, in 1991,it is clear that the sum of resources and e.g.books are one-fifth of the total, meanwhile, teachers’ salaries becomes a halve of the total school expenditure, however, after a decade it drops 11% unexpectedly as soon as the amount of furniture and equipment increase.
To conclude with, the proportion of the teachers’ salaries and insurance rise until the end, simultaneously, the others increase and fall down wavy within 20 years in UK school.

as soon as the amount of furniture and equipment increase.
as soon as the amount of furniture and equipment increases.
flaws:
Avg. Sentence Length: 32 21.0
More content wanted in the essay body.
Attribute Value Ideal
Score: 6.0 out of 9
Category: Satisfactory Excellent
No. of Grammatical Errors: 1 2
No. of Spelling Errors: 0 2
No. of Sentences: 5 10
No. of Words: 160 200
No. of Characters: 765 1000
No. of Different Words: 91 100
Fourth Root of Number of Words: 3.557 4.0
Average Word Length: 4.781 4.6
Word Length SD: 2.783 2.4
No. of Words greater than 5 chars: 54 60
No. of Words greater than 6 chars: 43 50
No. of Words greater than 7 chars: 35 40
No. of Words greater than 8 chars: 20 20
Use of Passive Voice (%): 0 0
Avg. Sentence Length: 32 21.0
Sentence Length SD: 11.576 7.5
Use of Discourse Markers (%): 0.6 0.12
Sentence-Text Coherence: 0.508 0.35
Sentence-Para Coherence: 0.889 0.50
Sentence-Sentence Coherence: 0.075 0.07
Number of Paragraphs: 4 4