You should spend about 20 minutes on this task.
The charts below show the percentage of their food budget the average family spent on restaurant meals in different years. The graph shows the number of meals eaten in fast food restaurants and sit-down restaurants.
You should write at least 150 words.
Give reasons for your answer and include any relevant examples from your own knowledge or experience.
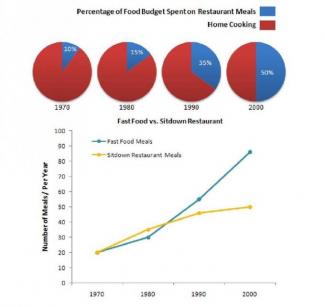
The two graphs indicate food budget was spent on eating out and home meals in average family and the figures of meals that people enjoyed fast food and sitdown Restaurant from 1970 to 2000.
With regard to the pie chart, the percentage of food budget spent only 10% in 1970 and 90% for home cooking. However, for two decades from 1970 to 1990, food budget increased in spending, it went up more than three time, 35% in 1990. Prio to that, the figure was just 15% in 1980 compared to 35% of home cooking. This number continued climbing quickly, 50% in 2000.
As for the line graph, number of meals that people enjoyed fast food meals rising gradually between 1970 and 1980, from starting point around 20 meals per year to about 25. Similarly, the number of sitdown Restaurant meals had the similar to trend for this period, it climbed to just over 30 in 1980 compared with about 20 in 1970. From 1980 to 2000, both of the two kind of meals increase but there was a significant increase in the number of Fast food meals, from just under 30 to nearly 90. It rose three time for just two decades. Meanwhile, people ate sitdown Restaurant meals going up slightly to nearly 50 in 2000.

The two graphs indicate food budget was spent on eating out and home meals in average family and the figures of meals that people enjoyed fast food and sitdown Restaurant from 1970 to 2000.
Description: can you re-write this sentence?
number of meals that people enjoyed fast food meals rising gradually
Description: what is the verb for 'number of meals'? can you re-write this sentence?
flaws:
You have issues on sentence structure.
Attribute Value Ideal
Score: 5.0 out of 9
Category: Satisfactory Excellent
No. of Grammatical Errors: 2 2
No. of Spelling Errors: 0 2
No. of Sentences: 10 10
No. of Words: 216 200
No. of Characters: 932 1000
No. of Different Words: 106 100
Fourth Root of Number of Words: 3.834 4.0
Average Word Length: 4.315 4.6
Word Length SD: 2.069 2.4
No. of Words greater than 5 chars: 55 60
No. of Words greater than 6 chars: 35 50
No. of Words greater than 7 chars: 19 40
No. of Words greater than 8 chars: 10 20
Use of Passive Voice (%): 0 0
Avg. Sentence Length: 21.6 21.0
Sentence Length SD: 9.308 7.5
Use of Discourse Markers (%): 0.5 0.12
Sentence-Text Coherence: 0.43 0.35
Sentence-Para Coherence: 0.577 0.50
Sentence-Sentence Coherence: 0.098 0.07
Number of Paragraphs: 3 4