The bar chart below shows the percentage of people in Great Britain living alone by age and sex in 2004/05.
Summarise the information by selecting and reporting the main features, and make comparisons where relevant.
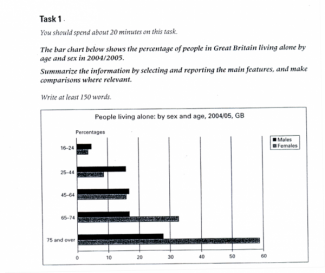
The bar chart gives the levels of individuals in Great Britain living alone by age and gender in 2004/05.
Overall, living alone was common among women as they went older. The 35-44-year-old people was the only category that was dominated by men.
The percentage of people living alone increased as they grew older. For instance, nearly 60% of females in the 75 and over age group tended to be single, in comparison with under 30% of males.
The second group age saw a dominance of males when approximately 25% of them chose to live separated while only under 10% of the opposite sex chose the same. Surprisingly, the first age group almost had a similar percentage (about 15%), and the same pattern can be seen for the third one. The dominance of female loners started in the 65-74 age group with over 30% of people are women, compared to 15% of men.
