The bar chart shows the number of visitors to three London Museums between 2007 and 2012.
Summarize the information by selecting and reporting the main features, and make comparisons where relevant.
Write at least 150 words
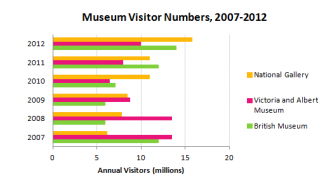
This bar chart represents the number of annual visitors on three different museums named National Gallery, Victoria and Albert museum and British Museum between 2007 and 2012. Overall, in 2012, significantly greatest number of people visited to National Gallery. Also least number of visitors was to British museum in 2009.
In early years 2007 and 2008, Most people visited to Victoria and Albert Museum with the same number in quantity over 13 million. Then this amount suddenly reduced to about half numbers of visitors in 2010. However, visitors to victoria and Albert museum gradually rose from 2010 to 2012.
Although the visitors to the National Gallery were very low numbers in 2007, It Progressively increased between 2007 and 2012. But, this quantity was equal in 2011 and 2010.
Moreover, in 2007 people visiting to British Museum was nearly high number with about 12 million. However, this quantity rapidly dropped to half in 2008 with 6 million. Then, number of annual visitors considerably went up between 2008 and 2012.

significantly greatest number of people visited to National Gallery
a great number of people visited National Gallery significantly
Most people visited to Victoria and Albert Museum with the same number
Most people visited Victoria and Albert Museum with the same number
Then this amount suddenly reduced to about half numbers of visitors in 2010.
Description: can you re-write this sentence?
Although the visitors to the National Gallery were very low numbers in 2007,
Description: can you re-write this sentence?
flaws:
No. of Grammatical Errors: 4 2
Attribute Value Ideal
Score: 4.5 out of 9
Category: Poor Excellent
No. of Grammatical Errors: 4 2
No. of Spelling Errors: 0 2
No. of Sentences: 11 10
No. of Words: 168 200
No. of Characters: 843 1000
No. of Different Words: 82 100
Fourth Root of Number of Words: 3.6 4.0
Average Word Length: 5.018 4.6
Word Length SD: 2.349 2.4
No. of Words greater than 5 chars: 72 60
No. of Words greater than 6 chars: 50 50
No. of Words greater than 7 chars: 27 40
No. of Words greater than 8 chars: 7 20
Use of Passive Voice (%): 0 0
Avg. Sentence Length: 15.273 21.0
Sentence Length SD: 5.395 7.5
Use of Discourse Markers (%): 0.636 0.12
Sentence-Text Coherence: 0.435 0.35
Sentence-Para Coherence: 0.65 0.50
Sentence-Sentence Coherence: 0.085 0.07
Number of Paragraphs: 4 4