The graph below shows the changes in food consumption by Chinese people between 1985 and 2010.
Summarise the information by selecting and reporting the main features, and make comparisons where relevant.
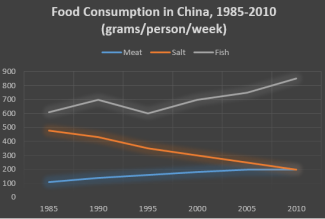
The given diagram illustrates data about the changes in food consumption in China over a twenty five-year period between 1985 and 2010. It can be obviously seen that the consumption of fish took the first place during the given period.
In 1985, the amount of fish consumption made up nearly 600 gr., whereas the proportion of meat consumption accounted for the lowest at approximately 100 gr. In the following 10 years, the figure relating to meat consumption gradually increased to slightly less than 200 gr., while the amount of salt declined from 500 to 300 gr. However, during this time, there...
Subscribe as testbig VIP readers and get unlimited access to essays on the top list.

Attribute Value Ideal
Score: 7.0 out of 9
Category: Good Excellent
No. of Grammatical Errors: 0 2
No. of Spelling Errors: 0 2
No. of Sentences: 8 10
No. of Words: 171 200
No. of Characters: 811 1000
No. of Different Words: 95 100
Fourth Root of Number of Words: 3.616 4.0
Average Word Length: 4.743 4.6
Word Length SD: 2.833 2.4
No. of Words greater than 5 chars: 52 60
No. of Words greater than 6 chars: 39 50
No. of Words greater than 7 chars: 32 40
No. of Words greater than 8 chars: 24 20
Use of Passive Voice (%): 0 0
Avg. Sentence Length: 21.375 21.0
Sentence Length SD: 4.357 7.5
Use of Discourse Markers (%): 0.625 0.12
Sentence-Text Coherence: 0.492 0.35
Sentence-Para Coherence: 0.685 0.50
Sentence-Sentence Coherence: 0.179 0.07
Number of Paragraphs: 3 4