The three pie charts below show the changes in annual spending by a particular UK school in 1981, 1991, and 2001.
Summerise the information by selecting and reporting the main features, and make comparisons where relevant.
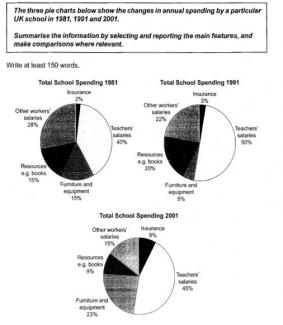
This figure shows the changes in annual spending by a particular UK school in 1981,1991 and 2001 by three different pie charts.
It is clear from the charts that Teachers' salaries always is the main concern for school authorities, and insurance became important after 1991, while Resources books and Furniture and equipment together take third place by fluctuating between 25% and 32%.
As is shown, teachers' salaries reach a peak in 1991 with 50% compared to 1981 with 40% and then it again became 45% in 2001. Insurance rose in every three years, and it started at 2% in 1981 and aroused to 3 percent in 1991 but the sharp increase happened in 2001 with 8%. On the other hand, other workers' salaries had a decreasing rate, and it declined from 28% in 1981 to 15% in 2001.
Overall, school authorities devote most of the total school spending to improve the quality of education and educational facilities, besides amenities of school.
