water usage in Australia
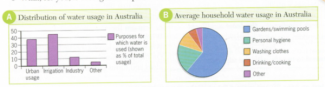
The two charts relate to different aspects of water usage in Australia. Chart A provides an overview of how water is used generally, whereas chart B gives a breakdown of household water usage.
From the bar chart we can see that a slightly higher percentage of water goes on irrigation than on urban usage, 45 per cent in fact, while the proportion of water used in industry, approximately 10 per cent, is far smaller than in either of these other areas.
From chart B we can see that the biggest proportion is on Gardens/swimming pools, more than 50%. Personal Hygiene comes in second place, which is nearly a third of the previous one percentage and the same as the total of the remaining three purposes. The other usages are for Drinking/cooking, Washing clothes and other purposes in which the proportion of Drinking/cooking and other purposes are almost the same and both proportions all together are the same as that of Washing clothes.

Attribute Value Ideal
Score: 7.0 out of 9
Category: Good Excellent
No. of Grammatical Errors: 0 2
No. of Spelling Errors: 0 2
No. of Sentences: 6 10
No. of Words: 165 200
No. of Characters: 761 1000
No. of Different Words: 93 100
Fourth Root of Number of Words: 3.584 4.0
Average Word Length: 4.612 4.6
Word Length SD: 2.493 2.4
No. of Words greater than 5 chars: 47 60
No. of Words greater than 6 chars: 39 50
No. of Words greater than 7 chars: 27 40
No. of Words greater than 8 chars: 14 20
Use of Passive Voice (%): 0 0
Avg. Sentence Length: 27.5 21.0
Sentence Length SD: 12.42 7.5
Use of Discourse Markers (%): 0.5 0.12
Sentence-Text Coherence: 0.466 0.35
Sentence-Para Coherence: 0.712 0.50
Sentence-Sentence Coherence: 0.223 0.07
Number of Paragraphs: 3 4