Task 1: The table below gives information about changes in modes of travel in England between 1985 and 2000. Summarise the information by selecting and reporting the main features, and make comparisons where relevant.
Image: http://3.bp.blogspot.com/-XHZ_nz_isqo/TWK0e1HYanI/AAAAAAAAAFg/KnG6qdEkt…
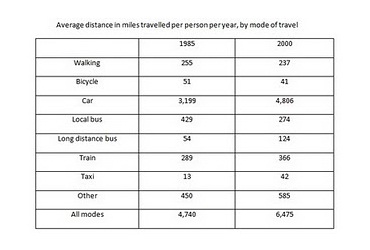
The table presents data concerning alteration in various different means of transport in England from 1985 to 2000.
Overall, there was a significant increase in the total number of distance travelled by all transportation types. Likewise, car remained England’s most popular vehicle for expedition during the given period.
Apparently, English people traveled mostly by car, which accounted for over 3000 miles per person per annum in 1985 and subsequently rose to an average of 4800 miles ...
| Post date | Users | Rates | Link to Content |
|---|---|---|---|
| 2013-05-31 | MisterWandering | 90 | view |

- The charts below give information about USA marriage and divorce rates between 1970 and 2000, and the marital status of adult Americans in two of the years.Summarise the information by selecting and reporting the main features, and make comparisons where 95

- The chart below shows numbers of incidents and injuries per 100 million passenger miles travelled PMT by transportation type in 2002 Summarise the information by selecting and reporting the main features and make comparisons where relevant 58
- The table below shows the figures for imprisonment in five countries between 1930 and 1980.Write a report for a university lecturer describing the information shown below. 90
- The exploration and development of safe alternatives to fossil fuels should be the most important global priority today To what extent do you agree or disagree 67
- Wearing uniforms is popular in schools but some people argue that it might cause damage to children s individuality What is your opinion 89
It is on top list:
http://www.testbig.com/essay-categories/ielts
Attribute Value Ideal
Score: 8.0 out of 9
Category: Excellent Excellent
No. of Grammatical Errors: 0 2
No. of Spelling Errors: 0 2
No. of Sentences: 8 10
No. of Words: 172 200
No. of Characters: 887 1000
No. of Different Words: 121 100
Fourth Root of Number of Words: 3.621 4.7
Average Word Length: 5.157 4.6
Word Length SD: 2.694 2.4
No. of Words greater than 5 chars: 66 60
No. of Words greater than 6 chars: 50 50
No. of Words greater than 7 chars: 37 40
No. of Words greater than 8 chars: 25 20
Use of Passive Voice (%): 0 0
Avg. Sentence Length: 21.5 21.0
Sentence Length SD: 5.979 7.5
Use of Discourse Markers (%): 0.625 0.12
Sentence-Text Coherence: 0.398 0.35
Sentence-Para Coherence: 0.707 0.50
Sentence-Sentence Coherence: 0.073 0.07
Number of Paragraphs: 4 4