The diagram gives information about the process of making carbonated drinks.
https://howtodoielts.com/wp-content/uploads/2020/09/118711718_147270213…
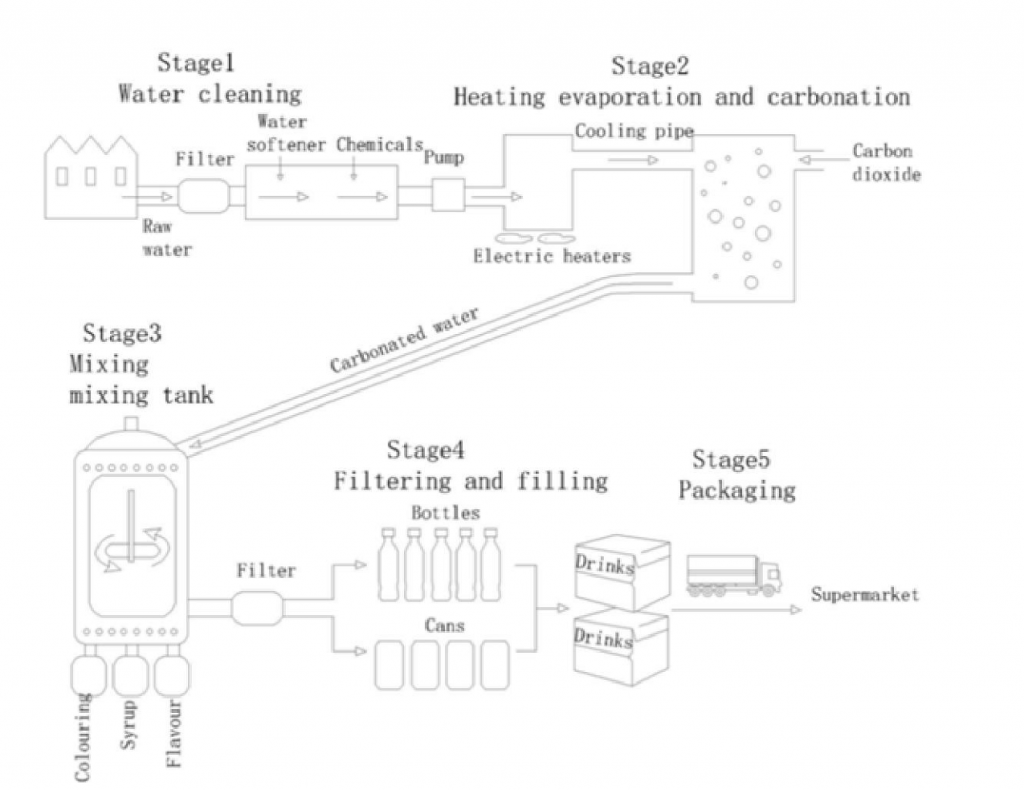
The picture illustrates the production of carbonated drinks. Looking from an overall perspective, it is clear that this man-made process comprises 5 stages, commencing with water being cleaned and ending with the transport of packages to supermarkets.
At the first stage of the process, raw water was being pumped from a big tank to a filter, where it is softened and then treated with chemicals, after which passing through this machine, pump water is cleaned into the electric heaters to evaporation before being cooled in a cooling pipe. Then, carbon dioxide is added to become carbonated water.
The process continues with stage 3 where the carbonated drinks are pushed into a big tank to mix with coloring, syrup, and flavor prior being filtered and filled into bottles as well as cans at the next step. Finally, carbonated water products packed into the boxes are delivered to the supermarket for retail.
| Post date | Users | Rates | Link to Content |
|---|---|---|---|
| 2022-10-08 | jadenguyen | view |

- The diagram gives information about the process of making carbonated drinks
- In some countries many more people are choosing to live alone nowadays than in the past Do you think a positive or negative development 61
- The diagram below shows how solar panels can be used to provide electricity for domestic use 61
- The graph below shows the consumption of fish and some different kinds of meat in a European country between 1979 and 2004 73
- Explain some of the ways in which humans are damaging the environment What can governments do to address these problems 56