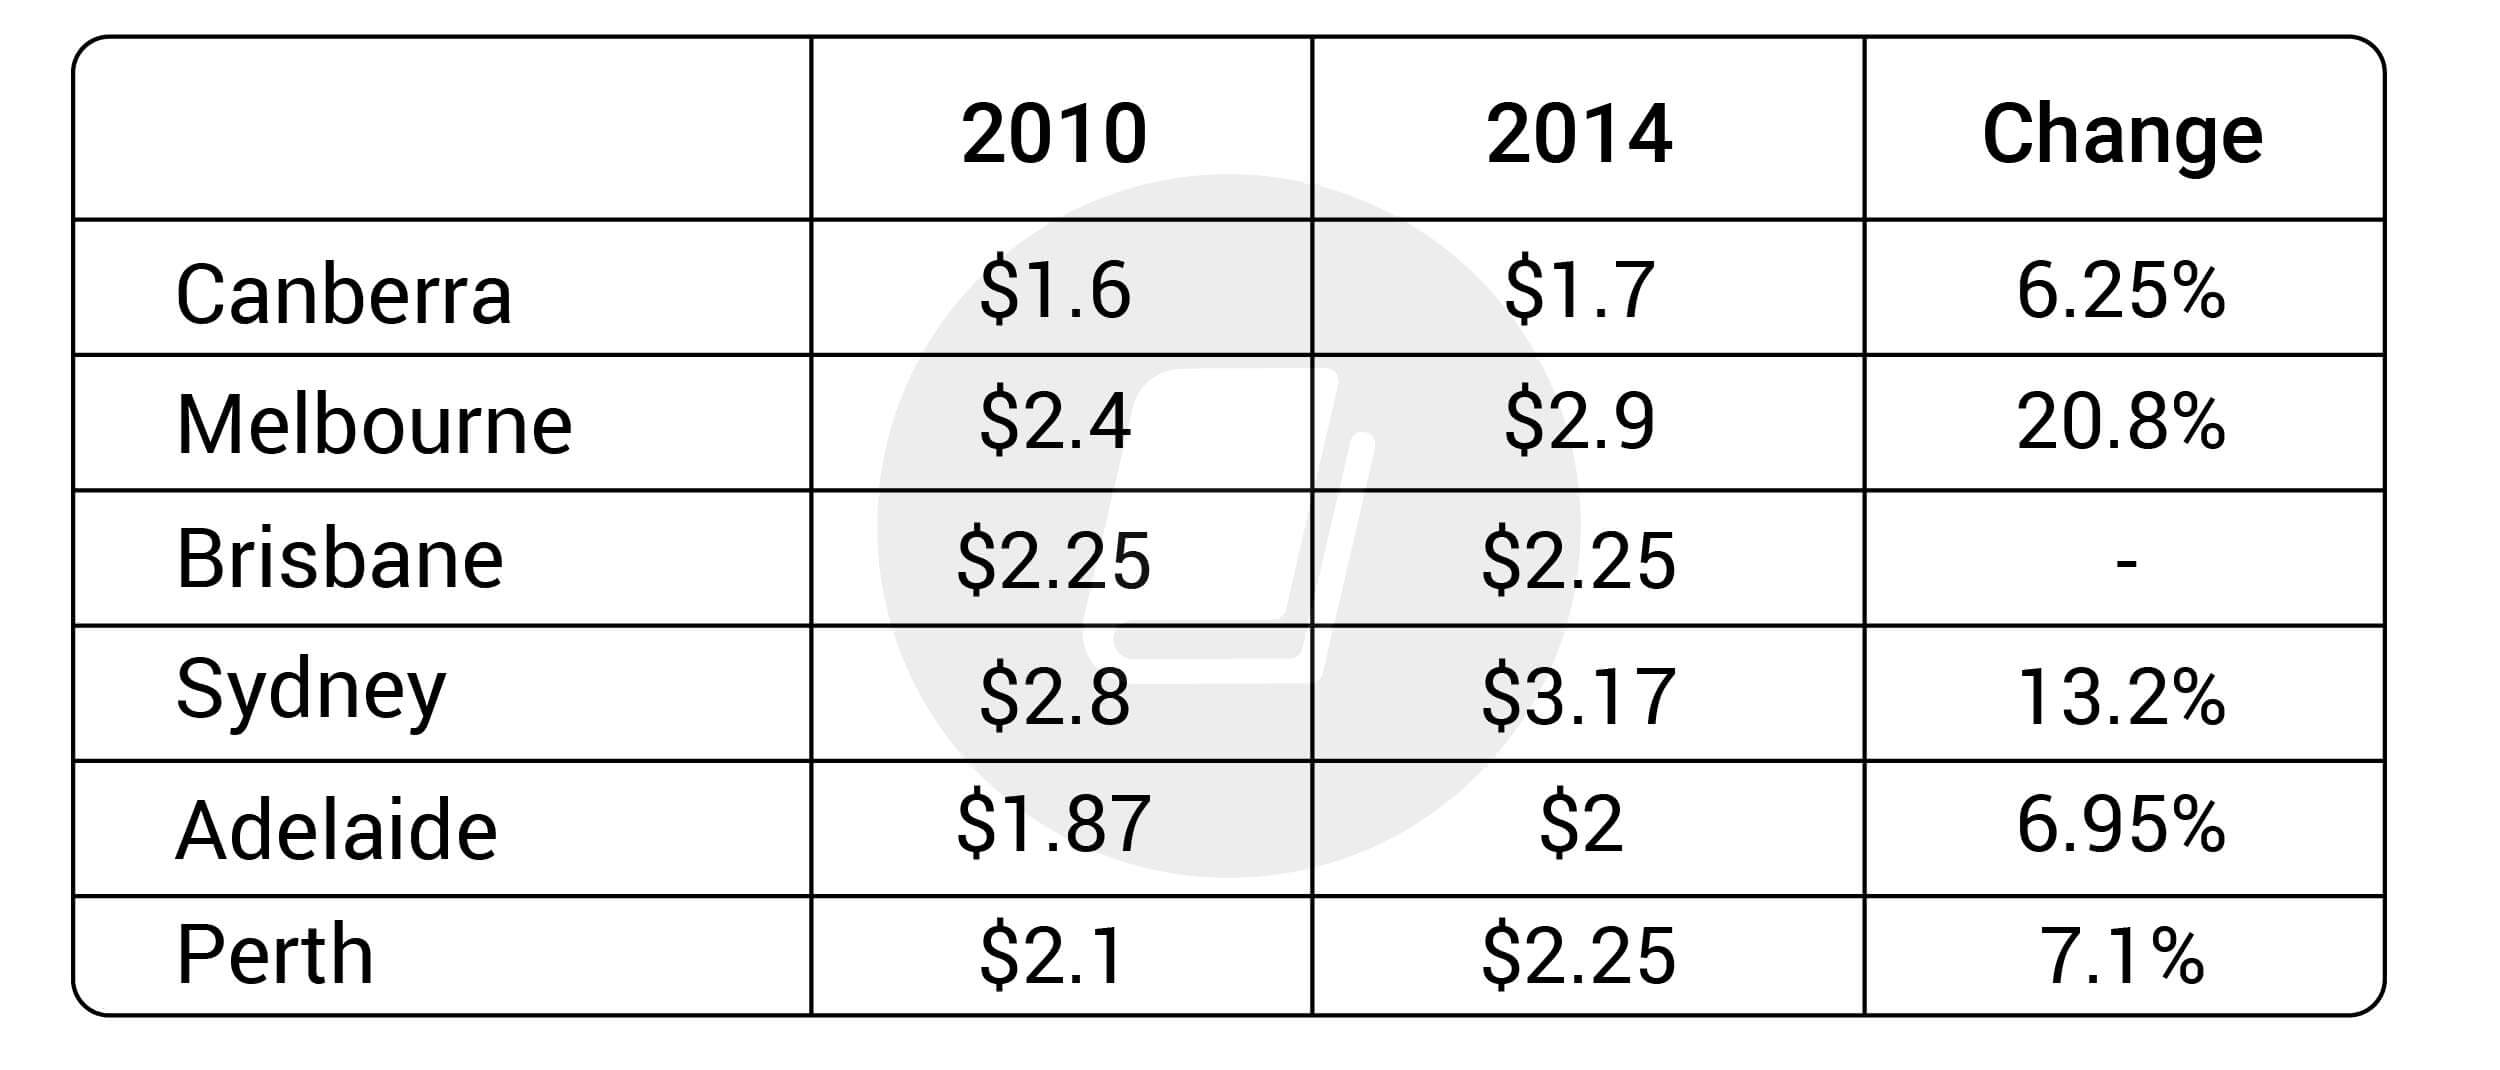
The table below shows the prices of a cup of coffee in 6 cities in Australia in 2010 and 2014.
https://media.zim.vn/61dc0bfe8d5ec6001fc40dfd/de-ielts-writing-task-1-n…
The given chart provides information about the amount of money spent on coffee in six various cities in Australia in 2010 and 2014.
Looking at the table, it is clear that people had to pay significantly higher for coffee in Sydney than the remaining. Moreover, the price in Melbourne experienced the most dramatic rise over the course of time.
It cost $2. 8 for a cup of coffee in Sydney in 2010. Then the price rose up 13. 2 percent four years later. Following that is Melbourne with the most remarkable change of 20. 8%, from 2. 4 to 2. 9 dollars. Brisbane reached the third when people needed to charge $2. 25 in both years.
While Perth had boosted its price by 7. 1 percent which means a coffee wasted 2. 25 in 2014, people in Adelaide spent 2 dollars more than those in Canberra with merely 1. 7.
