The chart below shows the number of men and women in further education in Britain in three periods and whether they were studying full-time or part-time.
Write at least 150 words.
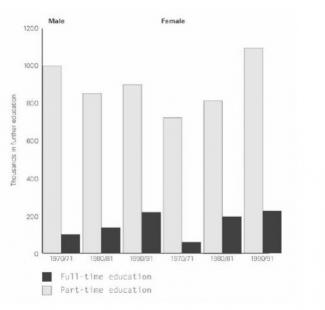
The bar graph represents the frequency and distribution of the population engaged in either full-time or part-time continuing education studies in Britain according to gender in three year periods.
Male population dominated the engagement in part-time studies for two consecutive periods (1970/71-1980/81), while female took dominance in the last period (1990/91). The trend in part-time studies among male population quite fluctuated having a decrease in engagement in the second period and gained increased in the last period. Despite of this increase, engagement in part-time studies among male...
Subscribe as testbig VIP readers and get unlimited access to essays on the top list.

Attribute Value Ideal
Score: 7.5 out of 9
Category: Very Good Excellent
No. of Grammatical Errors: 0 2
No. of Spelling Errors: 0 2
No. of Sentences: 8 10
No. of Words: 187 200
No. of Characters: 1010 1000
No. of Different Words: 85 100
Fourth Root of Number of Words: 3.698 4.0
Average Word Length: 5.401 4.6
Word Length SD: 2.704 2.4
No. of Words greater than 5 chars: 87 60
No. of Words greater than 6 chars: 64 50
No. of Words greater than 7 chars: 41 40
No. of Words greater than 8 chars: 37 20
Use of Passive Voice (%): 0 0
Avg. Sentence Length: 23.375 21.0
Sentence Length SD: 3.569 7.5
Use of Discourse Markers (%): 0.625 0.12
Sentence-Text Coherence: 0.575 0.35
Sentence-Para Coherence: 0.806 0.50
Sentence-Sentence Coherence: 0.256 0.07
Number of Paragraphs: 4 4