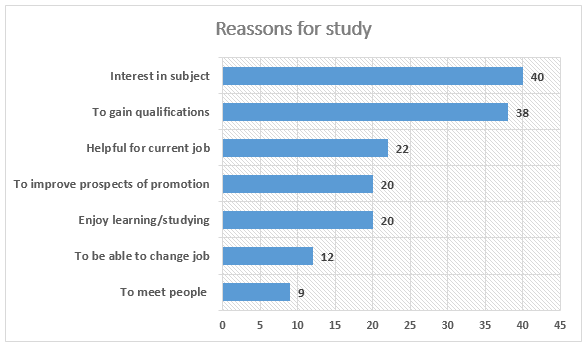
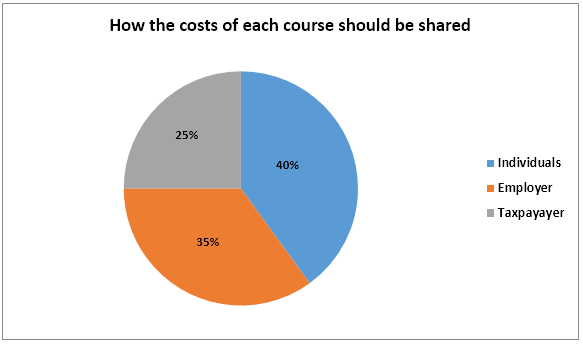
The charts below show the result of a survey of adult education. The first chart shows the reason why adults decide to study. The pie chart shows how people think the costs of adult education should be shared.
https://www.ielts-mentor.com/images/writingsamples/ielts-graph-85-reaso…
https://www.ielts-mentor.com/images/writingsamples/ielts-graph-85-how-c…
The figures illustrate the consequences of satisfaction levels of adults for education. The first chart shows what motivates them to determine to study. The second pie chart demonstrates their feelings about how the tuition expenses should be paid by themselves.
The ratio unveils that the majority finds the subject interesting and the further opinion is that it helps the learners enhance more experiences. The former is 40% while the latter is 38%, there is only a 2% difference. The other opines that studying can meet the demand for recent work (22%) and getting a promotion has the equal result with favorable activity (20%). Out of 100, only 12 people study to be capable of transfer jobs, 3 fewer pursue the interaction.
Regarding the course costs, most of the survey takers believe the individual and the employers should share the mainly spending 40% and 35% respectively. In contrast, taxpayers account for 25%, which is just one-third percent of the chart.
