You should spend 20 minutes on this task.
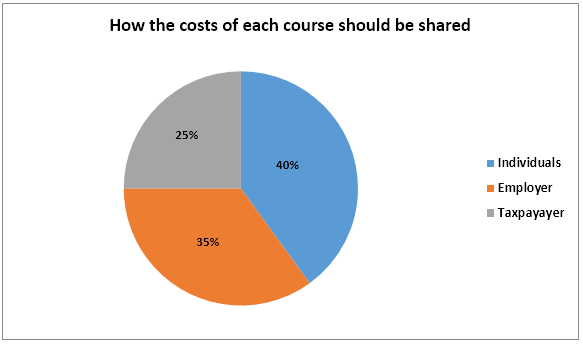
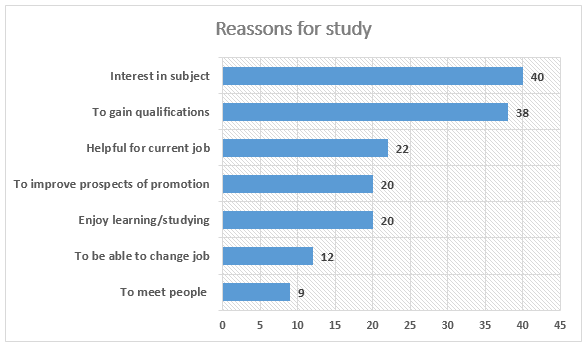
The charts below show the result of a survey of adult education. The first chart shows the reason why adults decide to study. The pie chart shows how people think the costs of adult education should be shared.
Write a report for a university lecturer, describing the information shown below.
You should write at least 150 words.
https://www.ielts-mentor.com/images/writingsamples/ielts-graph-85-how-c…
https://www.ielts-mentor.com/images/writingsamples/ielts-graph-85-reaso…
The given charts show the purposes why adults choose to study and how the tuition costs should be shared. Overall, two main reasons why people continued to study are the interest in subject and the degree. It is clear that most of the cost of the course should be funded by individuals.
Two major reasons accounted for 40% and 38%. At the same time, 22% think that studying higher is helpful for their running jobs. While 20% of adults selected to learn because of the improvement in prospects of promotion, the percentage of people enjoying studying is 20%. Finally, 12% studied further for the ability to change the occupation and only 9% studied to meet people.
According to the shown pie chart, 40% of the tuition costs should be paid by the individuals themselves. Whereas the employer has to fund 35%, the remain 25% should be provided by the taxpayer.
